


Know Your Monthly Number First: And, Here’s What History Says About Retirement Investments
Defining your monthly lifestyle cost is the first and most important step in retirement planning. Everything else—how large a nest egg you need, which assets to hold, how much guaranteed income to buy, and how much market risk you can tolerate—flows from that number.
Add up what you actually spend today on housing, food, healthcare, transportation, insurance, taxes, travel, and discretionary items. Then adjust for retirement: some costs fall (commuting, work clothes, payroll taxes), others often rise (healthcare, leisure, helping family). Convert the result into a realistic monthly figure and inflate it over a 25–30 year horizon using something close to the historical CPI average of 2.5%. That target income, minus Social Security and any pensions, is the gap your investments and annuities must fill.
Once you know the income you need, the historical record from 1991–2024 shows how different assets have delivered—and failed to deliver—that income.
Historical Returns and Risks (1991–2024)
The table below summarizes annualized returns, single-year extremes, and the worst decade-long stretches.
These figures illustrate both growth potential and sequence-of-returns risk—the danger that a bad market period hits just as you begin withdrawing money.
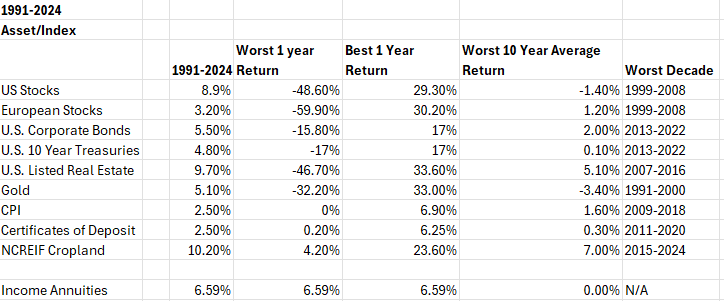
Data in the table cover calendar years 1991–2024 unless noted. Figures are historical index or published-benchmark results, not the returns of any client account. U.S. stocks: S&P 500 Index (total return) European stocks: MSCI EAFE Index U.S. corporate bonds: Moody’s Seasoned Corporate AAA bonds U.S. 10-year Treasuries: 10-year Treasury constant-maturity rate / related Treasury total-return series U.S. listed real estate: FTSE NAREIT All Equity REITs Index Gold: London Bullion Market Association (LBMA) gold price. Certificates of deposit: Bankrate national-average 1-year CD APY and FDIC national deposit rates. Returns assume the CD is held to maturity. Early-withdrawal penalties are not included. National averages are below the best online offers in most years. CPI: Consumer Price Index NCREIF Cropland: NCREIF Farmland Index, Annual Cropland Income annuities: Estimated payout rate of 6.59%, the estimate is based on average bond yields and on annuity estimate quotes available in 1991 for a 65-year-old couple, joint life, with cash refund. It is an illustration of a historical payout level, not a quote, guarantee, or offer of any contract available today. Actual annuity payouts vary by age, sex, state, insurer, payout option, and interest rates at issue. Where a series is a yield rather than a total-return index, total-return figures used in the table reflect price change plus income over the period shown. Indexes are unmanaged. You cannot invest in an index directly. Past performance is not a guarantee of future results.
What the Numbers Mean for Someone Near Retirement
Equities (US and European stocks, listed real estate)
US stocks compounded at 8.9% and listed REITs at 9.7% over the full period—attractive real returns after 2.5% inflation. The price of that growth is severe drawdowns: nearly –50% in the worst year and a lost decade (1999–2008) that produced a negative 10-year average for US stocks. European stocks lagged badly (3.2%) and suffered an even worse single-year loss. For a retiree taking withdrawals, a 40–50% drop early in retirement can permanently impair the portfolio. These assets belong in a retirement allocation for long-term growth and inflation protection, but they should not be the sole source of spending money in the first 5–10 years.
Bonds
Corporate bonds and 10-year Treasuries provided ballast in most periods, yet the 2013–2022 rising-rate environment produced the weakest 10-year stretches on record (2.0% and 0.1%). Bonds reduce volatility and supply income, but they have not been a reliable growth engine recently and can lose purchasing power when inflation spikes.
Certificates of Deposit
CDs protected principal and paid a known rate, but the national average 1-year CD compounded at only about 2.5% from 1991–2024, spent a full decade near 0.2–0.3%, and never produced a stock-like loss—or a stock-like gain.
Gold
Gold returned 5.1% with a best year of +33% and a worst of –32%. Its worst decade (1991–2000) was negative. It has served as a crisis and inflation hedge at times, but it produces no cash flow and can underperform for long stretches. A modest allocation can diversify; a large one adds volatility without reliable income.
Agriculture and Cropland
U.S. agriculture and the NCREIF Cropland index stand out for high returns (8.9% and 10.2%) combined with unusually muted downside. The worst calendar year for NCREIF Cropland was still +4.2%, and its weakest 10-year period was +7.0%. These assets have historically shown low correlation with stocks and bonds and have kept pace with or beaten inflation. Access for most individual investors is limited (direct ownership is illiquid and operationally intensive; some funds and REITs exist). They illustrate the value of real assets that generate both income and appreciation.
Income annuities
A payout rate of 6.59% that never changes is the definition of predictability. There is no market risk, no sequence-of-returns risk, and no “worst year.” The trade-offs are loss of liquidity and flexibility, potential loss of remaining principal at death (depending on the contract), and no automatic inflation adjustment unless a cost-of-living rider is purchased (which lowers the initial payout).
Annuities convert a lump sum into a lifetime paycheck and can cover essential monthly expenses so that remaining investments can stay invested for growth.
Putting It Together
Start with the monthly number. Decide how much of that number you want guaranteed (Social Security + pension + annuity) versus variable. Use the historical extremes above to stress-test the variable portion: could your portfolio survive a –48% stock year or a decade of near-zero bond returns while still funding the gap?
A practical approach for many pre-retirees is a barbell: enough annuity or bond income to cover non-discretionary costs, a diversified growth sleeve (stocks, REITs, perhaps a small real-asset or farmland allocation) for longevity and inflation, and cash or short bonds for the first few years of withdrawals.
Revisit the plan as markets and personal circumstances change; the 1991–2024 record is a useful map of what has happened, not a guarantee of what will happen next.
The data make one point clear: no single asset class is both high-return and low-risk. Defining the lifestyle you actually want to fund is what lets you choose the mix that is good enough.
Work With John
For more than 20 years, John and his team have helped successful individuals and families plan, preserve, protect, and pass on their hard-earned wealth. Based in Naperville, Illinois, John works with clients in Naperville, Plainfield, Darien, Aurora, Geneva, St. Charles, and throughout the United States.

Coming November 2026
John’s new book, Retire on Your Terms: Unlocking the Secrets to a Custom, Confident, and Certain Retirement (Special Edition), picks up where this article leaves off: how to define the monthly lifestyle you actually want, then build a plan around returns, risk, and guaranteed income.
If you would like a copy when it is released, email us at ebuchta@stantongwp.com with the subject line “Retire on Your Terms” and we will add you to the list.
Learn more about John’s services at stantongwp.com/team-member-01, or connect with him on LinkedIn at linkedin.com/in/john-stanton.
Let’s start a conversation
Have questions about the numbers in this article, want a copy of the book, or ready to talk about your own retirement plan? Schedule a call today.Schedule a Call With Stanton Group Wealth
Stanton Group Wealth Partners, Inc. is an Illinois-registered investment adviser. Stanton Group Wealth Partners ADV This article is educational and is not a recommendation. Past performance does not guarantee future results. Index returns are not client results. Insurance and annuities offered through Stanton Group Wealth Partners, Insurance License Number 100757645. Annuity guarantees depend on the insurer. Illinois annuity recommendations are subject to the best-interest and compensation-disclosure rules in 50 Ill. Adm. Code Part 3120. Request Form ADV Part 2. Not FDIC-insured.